我国人口死亡率分析的相关问题 Mortality Rate in China
生存分析是发现死亡率的关键,既往的研究表明我国人口普查中(比如历次人口普查数据)中,低龄人口(0-5岁)和高龄人口(60岁以上)死亡漏报现象比较突出。 最近的一篇文章分析了第七次全国人口普查的资料,很不错here。可以在此文的基础上再进一步的分析。
世界死亡数据库有很多数据(https://www.mortality.org/Data/DataAvailability),PNAS的一篇论文分析了其中部分资料(https://github.com/CPop-SDU/sex-gap-e0-pnas)。
联合国2024年世界人口展望(World Population Prospects 2024)发布了一系列国际数据,其中有我国历年来的寿命表数据,下载地址为here
稍微整理了一下,结果如下图所示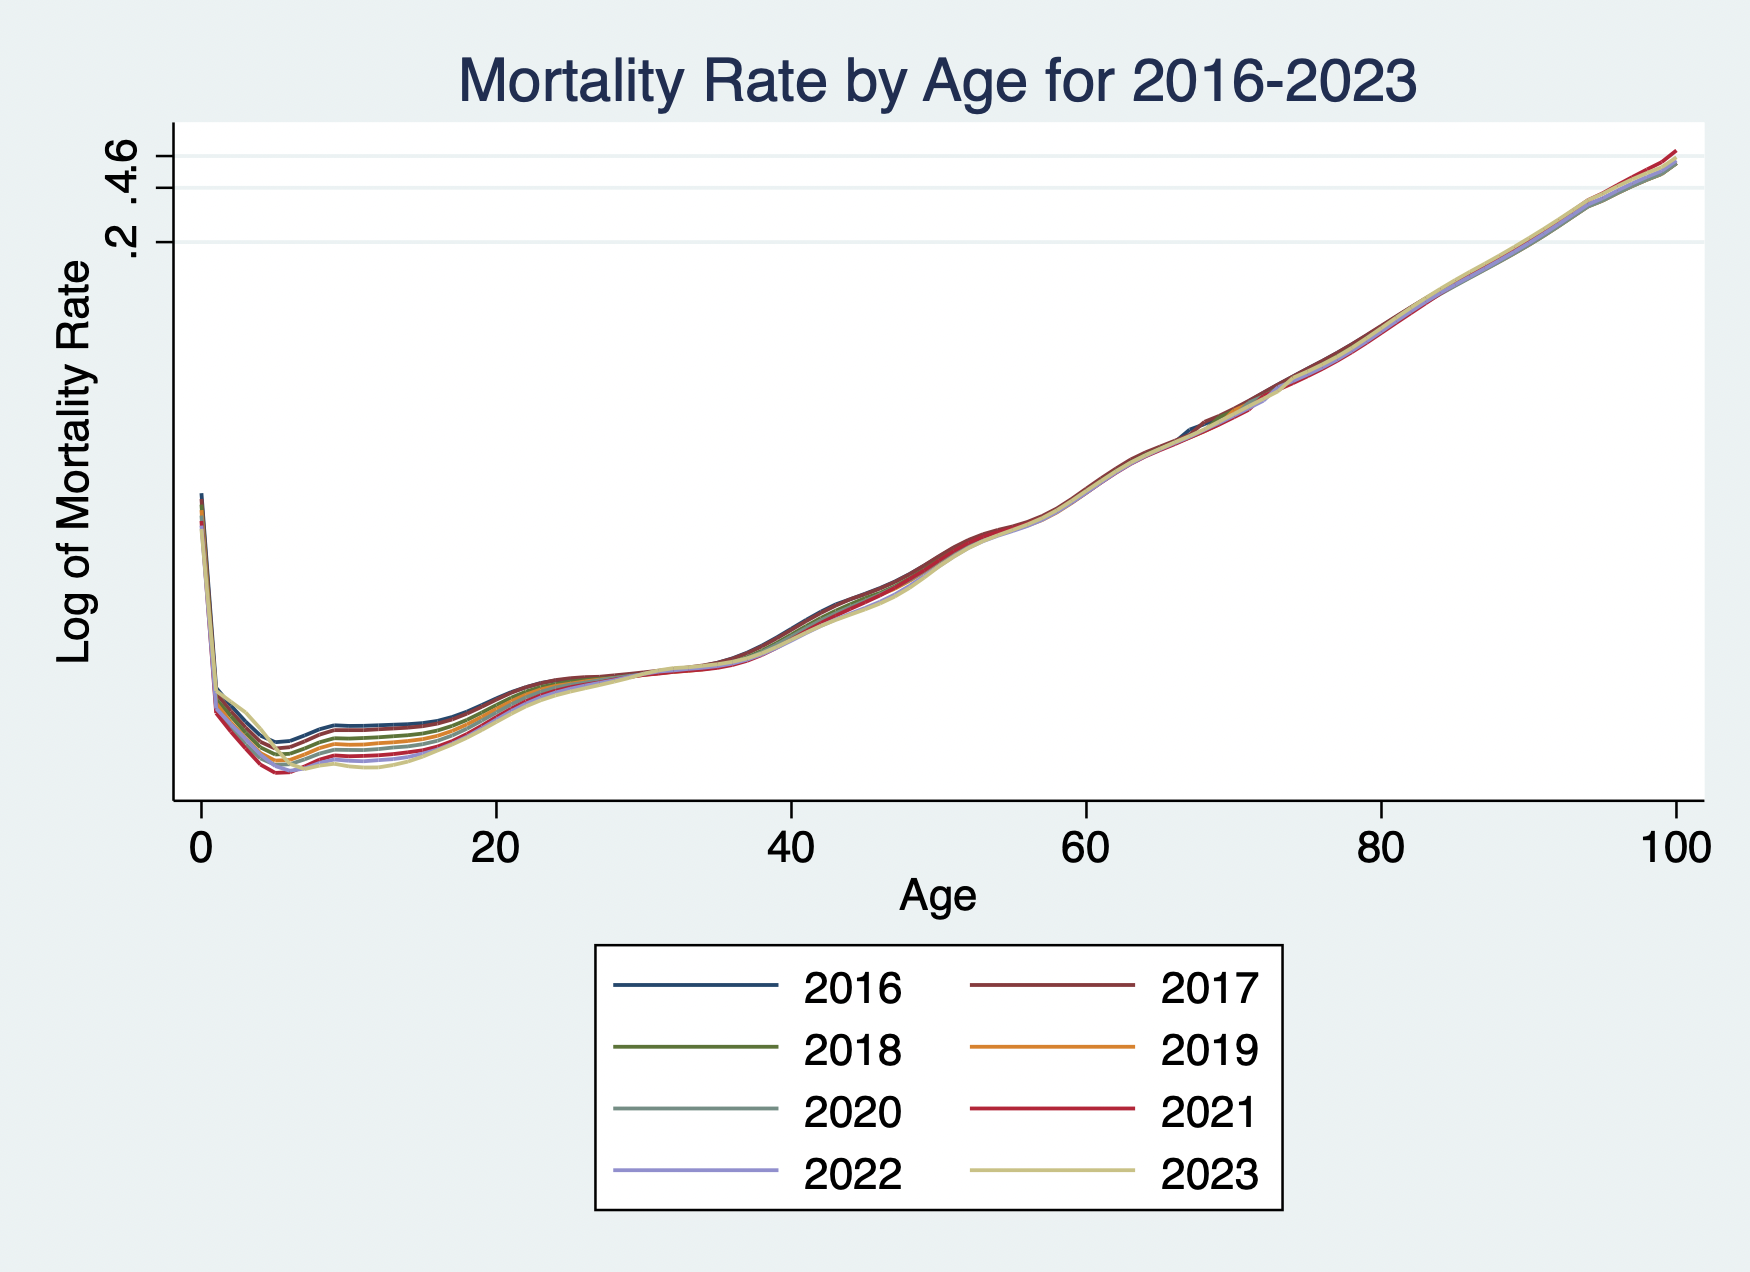
* Define the years you want to plot
local years 2016 2017 2018 2019 2020 2021 2022 2023

* Define colors and line patterns
local colors red blue green purple orange brown black gray
local patterns solid dash dot dash_dot longdash shortdash

* Initialize the graph command
local graph_cmd ""

* Loop through the years and build the graph command
foreach y of local years {
    local color : word `y' of `colors'
    local pattern : word `y' of `patterns'
    local graph_cmd `"`graph_cmd' (line mx age if Year == `y', lc(`color') lp(`pattern'))"'
}

* Plot all lines on the same graph with a logarithmic y-axis
twoway `graph_cmd', yscale(log) legend(label(1 "2016") label(2 "2017") label(3 "2018") label(4 "2019") label(5 "2020") label(6 "2021") label(7 "2022") label(8 "2023")) ///
title("Mortality Rate by Age for 2016-2023") ///
ylabel(, format(%9.0g)) ytitle("Log of Mortality Rate") xtitle("Age")